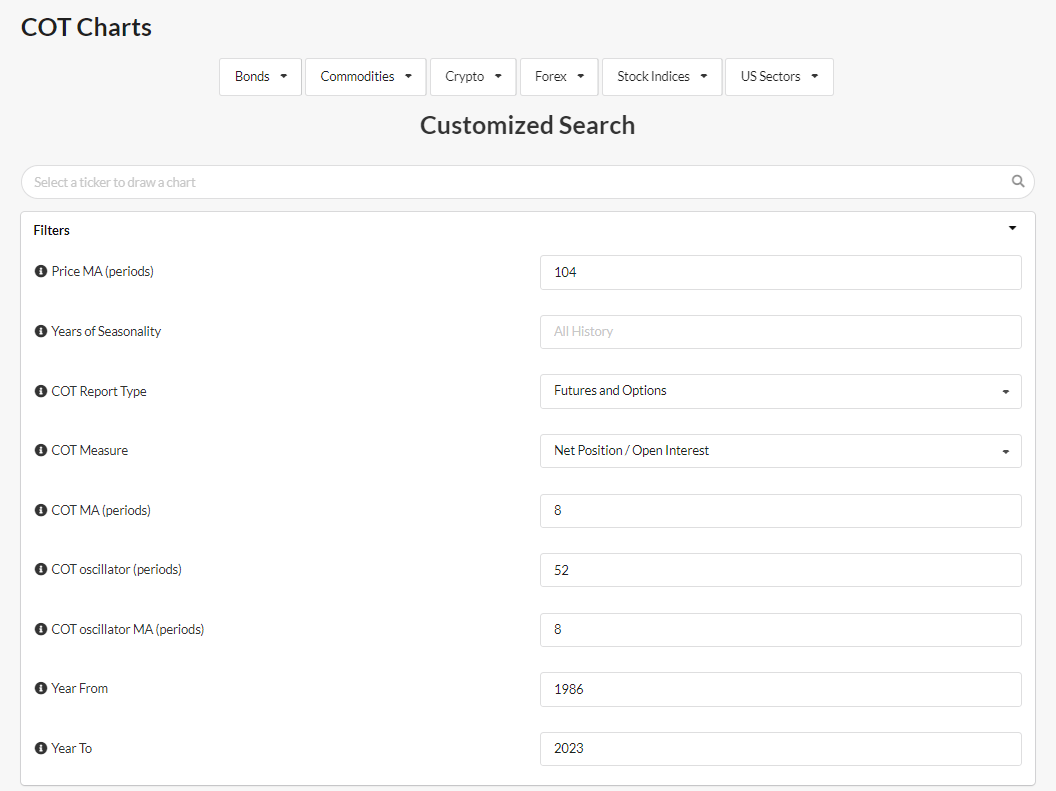
COT Filters
COT filters allow to customize the elaboration of raw COT-data. For example, to decide the Periods of the Indicators, and whether to apply Moving-Averages in order to smooth lines.
Below, a detailed explanation of each parameter. You can find the same information in the COT charts page, in the (i) info boxes.
- Price MA (periods)
- the n°of periods (in weeks) to compute the simple moving average over the price of the instrument.
- Trend is your friend, and Moving Average can be useful to determine it.
- The Moving Average will appear in the same sub-chart of the price.
- Example of Periods: 26w (6 months), 39w (9 months), 52w (1 year).
- Years of Seasonality
- the n°of years used to compute Seasonality. To use All-History available for an instrument, leave this field blank.
- it matters only if 'Show Seasonality' is selected from 'Chart Filters'.
- The algorithm computes the 'Detrended Seasonality' with a 'Rolling-Years' method. For example, if 'Years of Seasonality'=5:
- the seasonality of 2021 will be computed from 2016 to 2020;
- the seasonality of 2020 with the returns from 2015 to 2019;
- etc.
-
COT Report Type
It is a choice between:- Futures and Options: to see net-positions of operators for both Futures and Option Markets
- Futures only: to see net-positions of operators only for Futures Market
(This parameter is applied to both Legacy and Disaggregated raw-data and oscillators)
-
COT Measure
It is a choice between:- Net Position / Open Interest: to see the Net-positions of each group of operators as a percentage of the Open Interest
- Net Position: to see the Net-positions of each group of operators in dollars
(This parameter is applied to both Legacy and Disaggregated raw-data)
-
COT MA (periods)
- Is the number of periods of a Weekly Moving Average (MA) applied to COT-raw data (not oscillators).
- Moving average is useful to smooth the line, to reduce the noise and see the trend more clearly.
- For example, if 'COT MA'=8 ==> the last data of a COT group (e.g. Non-Commercials) will be the average of the last 8 observations
(This parameter is applied to both Legacy and Disaggregated raw-data)
-
COT oscillator (periods)
- It is the period, in weeks, used to compute the oscillators.
- For example, if 'COT oscillator'=52 ==> the oscillator will show how the group 'Commercials' is positioned today with respect to the 52 previous weeks.
(This parameter is applied to both Legacy and Disaggregated oscillators)
-
COT oscillator MA (periods)
- It is the n°of periods (in weeks) to be used to compute the Simple-Moving-Average over the COT oscillator data (e.g. over the Commercials Net-position oscillator).
- For example, if 'COT oscillator MA'=8 ==> the last data of a COT group oscillator will be the average of the last 8 observations
(This parameter is applied to both Legacy and Disaggregated oscillators)
- Year From
- the starting year of the Charts
- default is 12 years-ago
- Year To
- the ending year of the Charts
- default is the current-year