The Lunar cycle effect (Moon)
The Lunar cycle effect (MOON) is searched in the lunar cycle, that
- can be divided in 4 or 8 phases
- lasts 29.53 days
Introduction
As moon influences natural events, it can be studied whether moon influences financial markets.
The timing of the lunar phases is not exactly corresponding to the months since they shift by an average of 0.91 days each month, and 9 days each year:
- The Gregorian calendar month, which is 1⁄12 of a tropical year, lasts 30.44 days on average. And a calendar year lasts 365 days
- the lunar cycle (the Moon's synodic period) lasts 29.53 days on average, and a lunar year lasts about 354 days
Lunar Cycle periods must be computed precisely, and it would be an error to say that periods of the anomalies 'Month of Year' (MOY) and 'Within the Month' (WTM) include the Lunar-cycle ones.
The days of difference between months and lunar cycles are larger as we expand time. There are:
- 9 days of difference every year.
- 90 days (3 months) of difference every 10 years.
More detailed, the moon takes 27.3 days to orbit Earth, but the lunar phase cycle (from new Moon to new Moon) is 29.5 days. The Moon spends the extra 2.2 days "catching up" because Earth travels about 45 million miles around the Sun during the time the Moon completes one orbit around Earth.
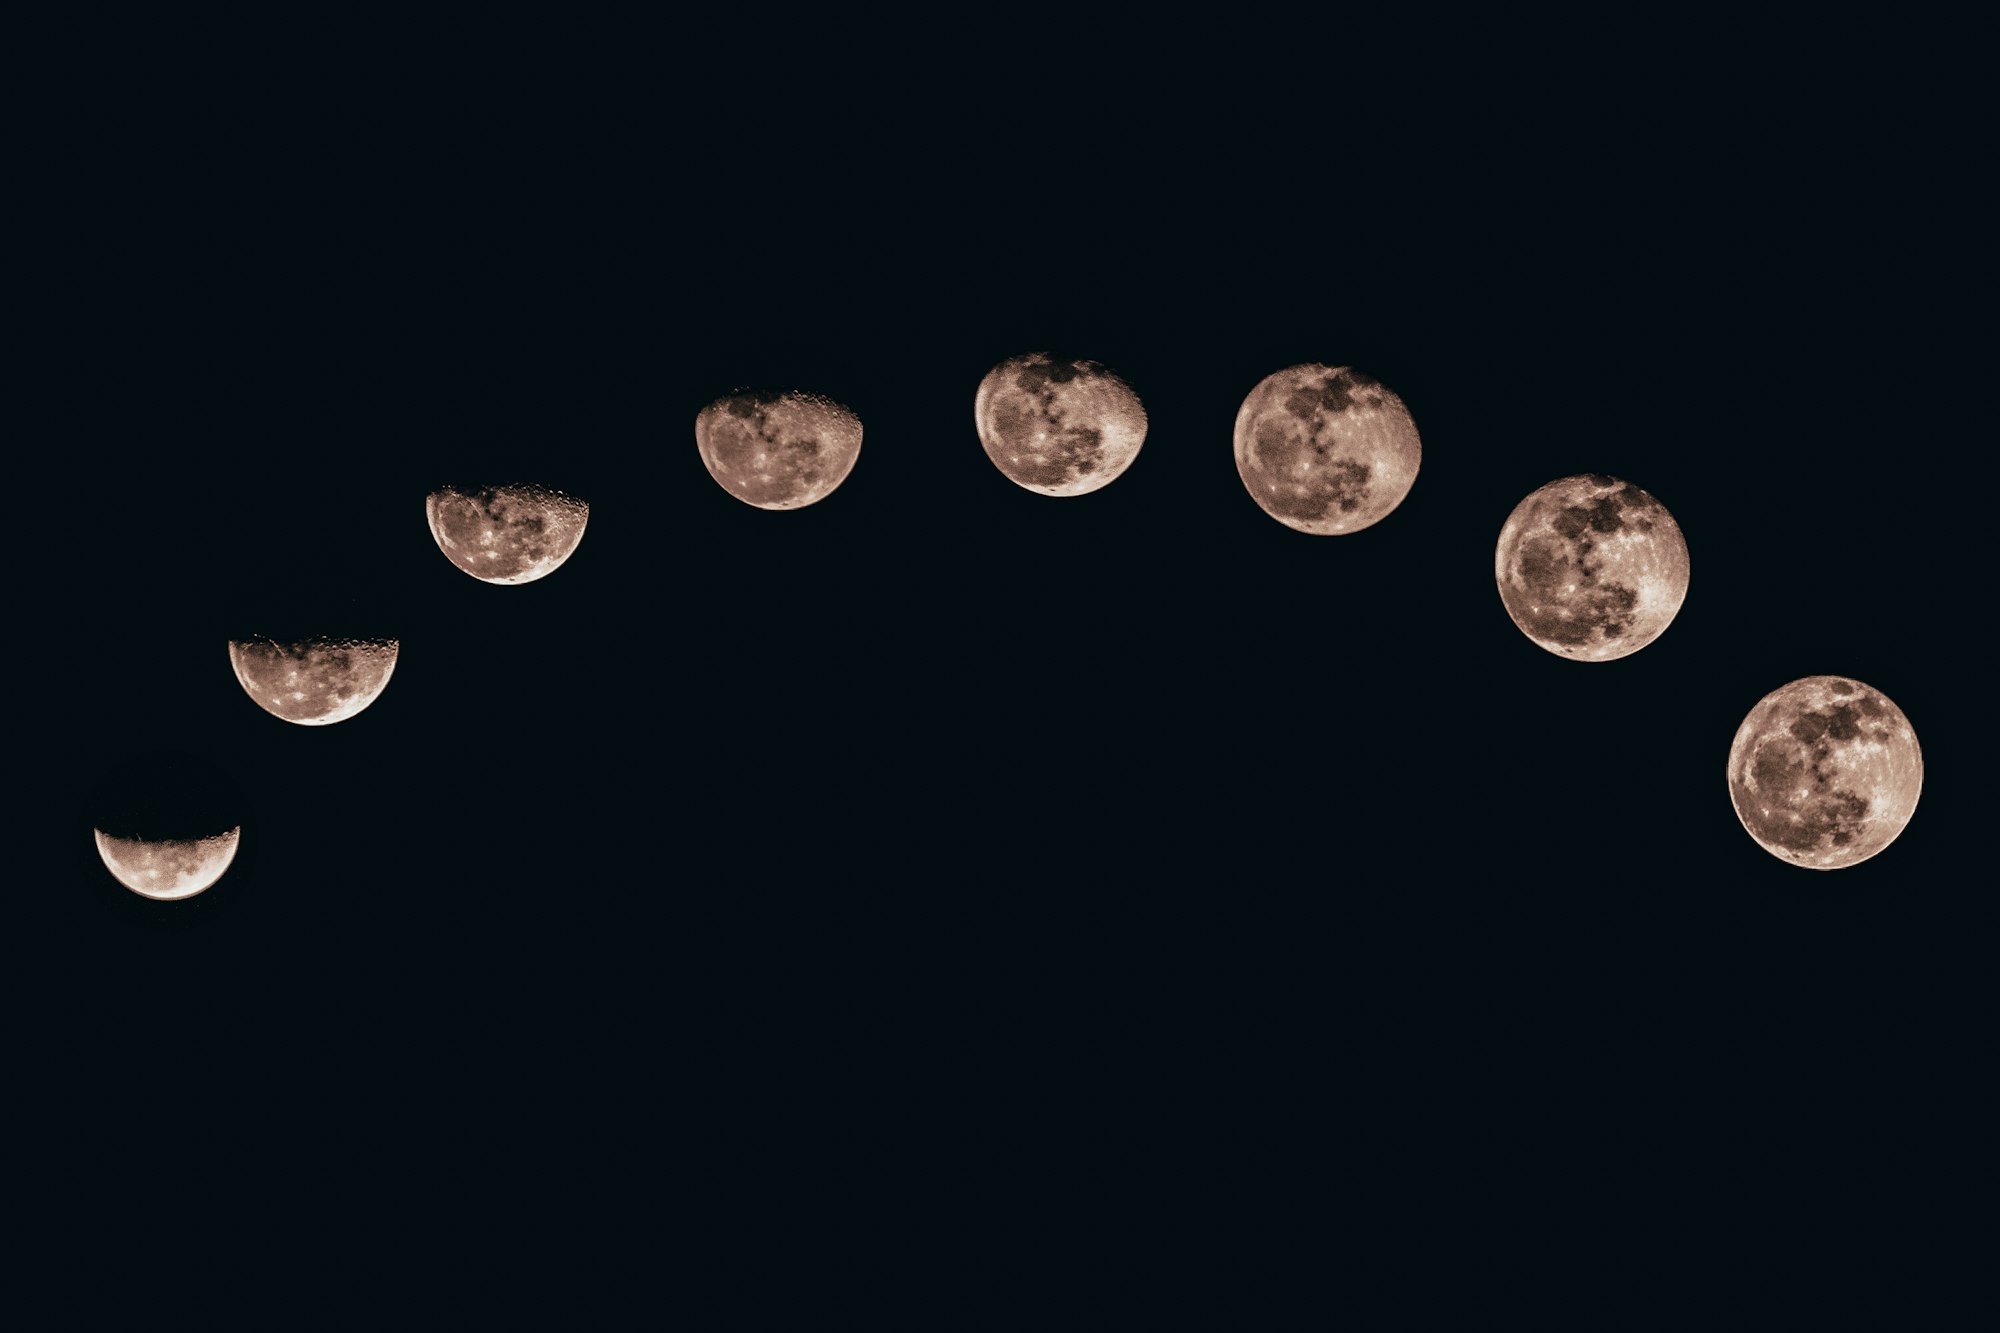
Lunar Cycles phases
The Lunar Cycle can be divided in two different ways:
- 4 phases
- 1/4 - New Moon
- 2/4 - First Quarter
- 3/4 - Full Moon
- 4/4 - Last Quarter (also known as a third or final quarter)
- 8 phases
- 1/8 - New Moon
- 2/8 - Waxing Crescent
- 3/8 - First Quarter
- 4/8 - Waxing Gibbous
- 5/8 - Full Moon
- 6/8 - Waning Gibbous
- 7/8 - Last Quarter
- 8/8 - Waning Crescent
This does not impact the anomaly search, but it is interesting to know that countries in the different hemispheres see the Moon from a completely different vantage point from each other:
- the first quarter
- in the northern hemisphere looks like a growing "D", while
- in the southern hemisphere it looks like a "C".
- the last quarter
- In the northern hemisphere looks like a "C", while
- in the southern hemisphere looks like a "D".
Literature review
Qadan er al. in their paper “Seasonal patterns and calendar anomalies in the commodity market for natural resources”, starting from a study in which it was found a correlation between lunar cycle, particularly with the full moon periods, and stock returns, they checked the correlation also in commodity market, but without noticing statistically significant results about the full moon effect:
“Yuan et al. (2006) provide evidence that market index returns are correlated with the lunar cycle, such that stock returns are lower on the days near full moons (FM) than on other days.
Floros and Tan (2013) report that this anomaly exists in emerging markets but is weak in the US. Lucey (2010) addresses this effect in precious metals (gold, silver, and platinum) for 1998 to September 2007, and reports that the lunar cycle effect is more pronounced in silver than gold, with very little evidence for an effect in platinum.
To test if such an anomaly also exists in other commodities, we define FM using three different windows of time. The first full moon dummy variable (FM 1) captures the full moon day itself; the second dummy captures a window of (−3, +3) days around full moon days (FM 3), and the last one (FM 7) captures (−7, +7) days around them. The results in show that the precious metals market is efficient regardless of the sample period considered. In fact, in PanelsA (FM1) and C (FM3) the FM i coefficients are generally negative.
Even though they are statistically insignificant, the negative tendency is noticeable. The only exception is copper, which exhibits positive returns for FM 3 and FM 7. There is a clear tendency for less volatility on FM days as evident in the coefficients of FM > 04 and FM < 04 for silver, oil, heating oil and natural gas. Thus, the overall findings suggest that such an anomaly does not exist in precious metals.
Finally, the FM contribution to conditional variance differs between commodities but seems to be associated with less influence for the period before 2004. Anyway, in most cases, FM is not statistically significant in the variance part.”
Conclusion
There is not much literature about Lunar Cycle effect, anyway ForecastCycles Platform is searching for Moon anomalies in all markets, and you can spot them using the Advanced Screener.
Another test that could be made is the check whether the distance of the moon to the Earth, which is like an elastic, and its tendency to move closer or away to the Earth are correlated to financial asset returns.