Portfolio Details page
This page contains the results of the backtest of one Portfolio.
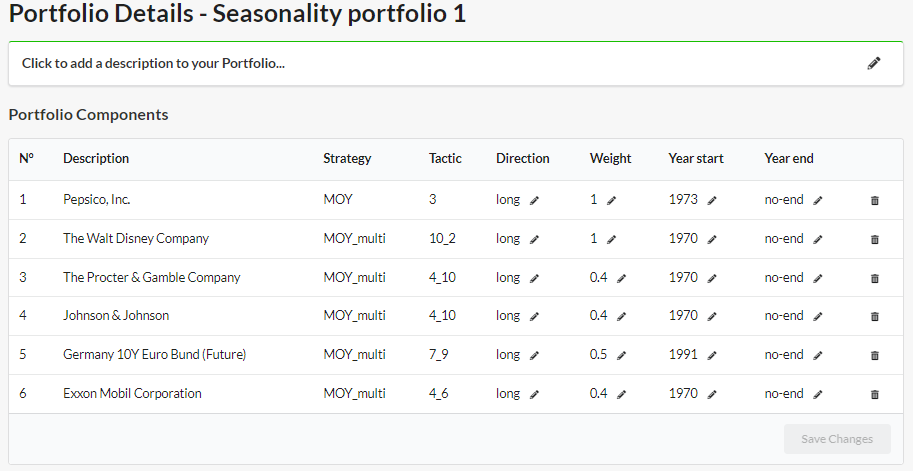
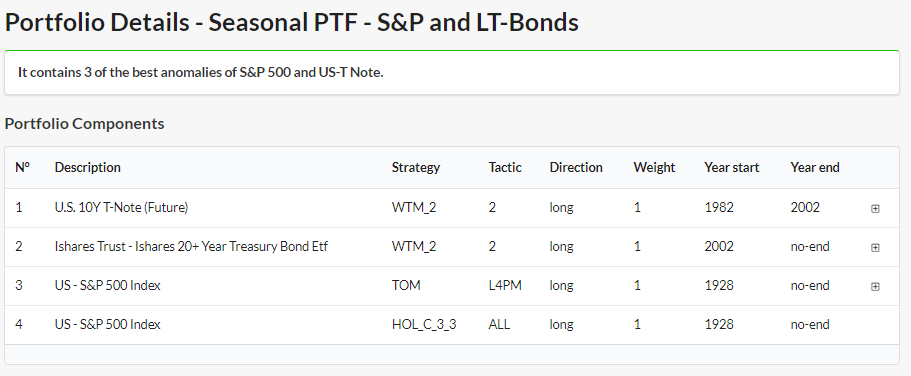
In the top of the page there are the information about the Portfolio.
Portfolio Settings
There are differences in the actions you can do whether you are the Author of the Portfolio or not.
If you are the Author you can:
- edit the Name
- edit the Description
- edit the Portfolio components:
- Delete the component: garbage icon
- change the Direction: long or short
- change the Weight: it is the multiplier of each trade return
- change the Year start and Year end: by default is considered the entire history available.
When you have completed the changes, click on Save Changes button. Portfolio backtest will be computed with the new settings (it may take a minute).
If you are NOT the Author, you can:
- add Anomaly to 'My Anomalies': plus icon


Run the Backtest
To run the backtest and compute Portfolio equity-line and statistics:
- choose the Year from and Year to. By default it is choosen the entire history available.
- click the button Compute Statistics
The backtest is computed using Net Returns: returns obtained by Anomalies after deducting trading costs.
Backtest Results
The results are composed by:
- Equity Lines chart
- there are two lines: the equity of the Portfolio (black line) and the equity of S&P 500 index as Benchmark (red line)
- it is possible to customize the chart by clicking the chart icon in the bottom-right of the page.
- Statistics table
- it contains 'Net-Statistics' computed in the 'Entire History'
- the explanation of the backtesting metrics is available in this article
- if a metric
- is red => is worse than the Benchmark one
- is green => is better than the Benchmark one
Video on YouTube
All Anomalies page presentation and tutorial is available on YouTube


