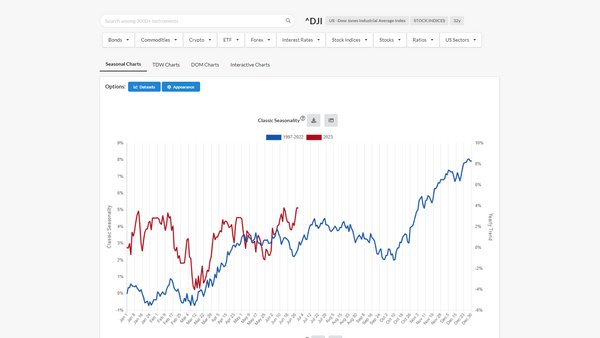
TDW Charts tab
TDW Charts tab contains the returns of the Ticker in the different Trading Days of the Week.
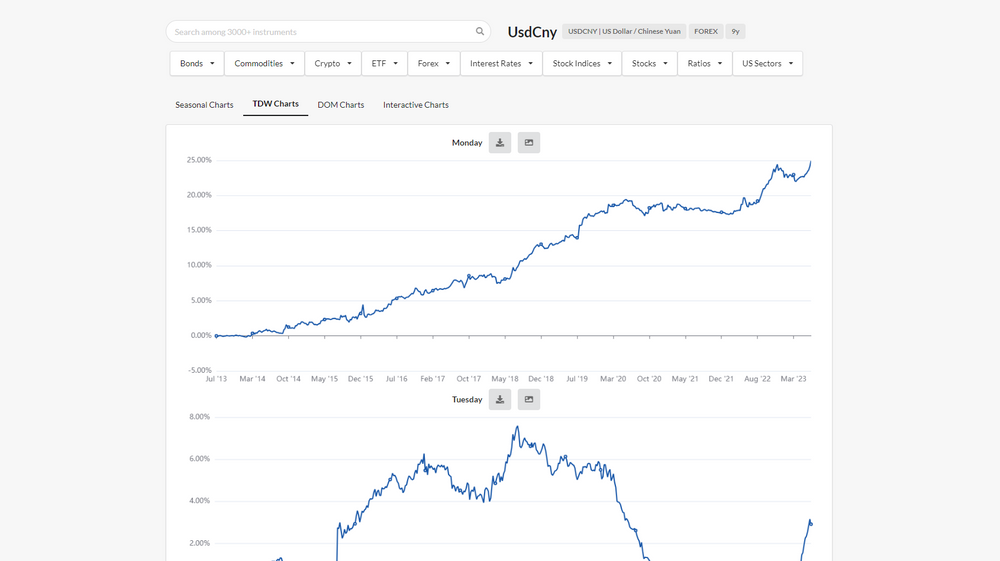
TDW Charts
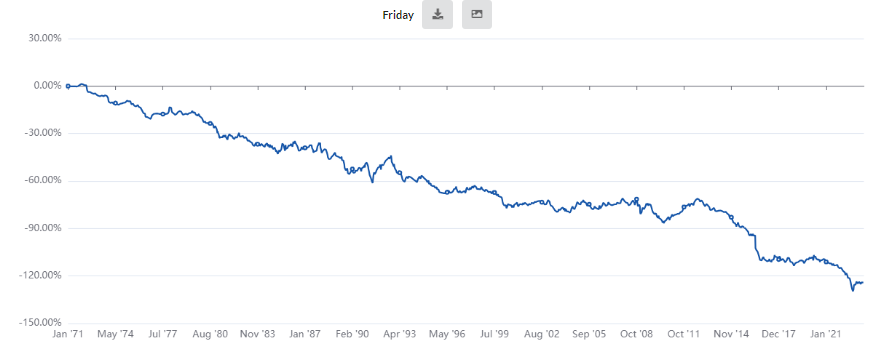
The Y-scale of the chart is in percentage, and represents the evolution of the capital:
- in the entire historical data available of the Ticker
- in simple capitalization, by investing the same amount of money each trade
- by buying the Ticker at the opening price of the Weekday,
- and closing the long position at the closing price of the same Weekday
TDW Strategies
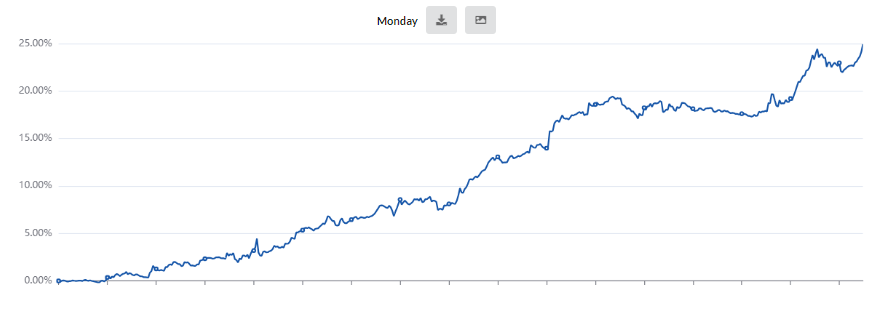
TDW Charts can be useful for both long and short strategies; two examples:
- Long case: USDCNY (US Dollar / Chinese Yuan) on Monday
- Short case: GBPUSD (GB Pound / US Dollar) on Friday
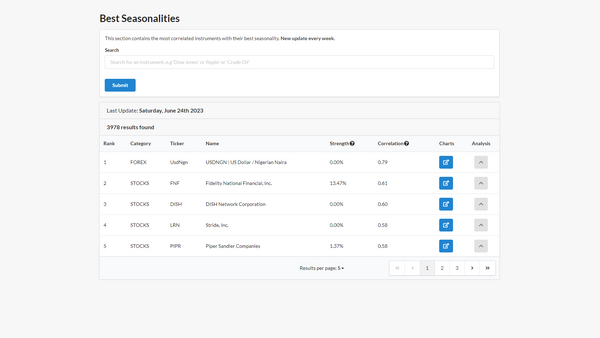
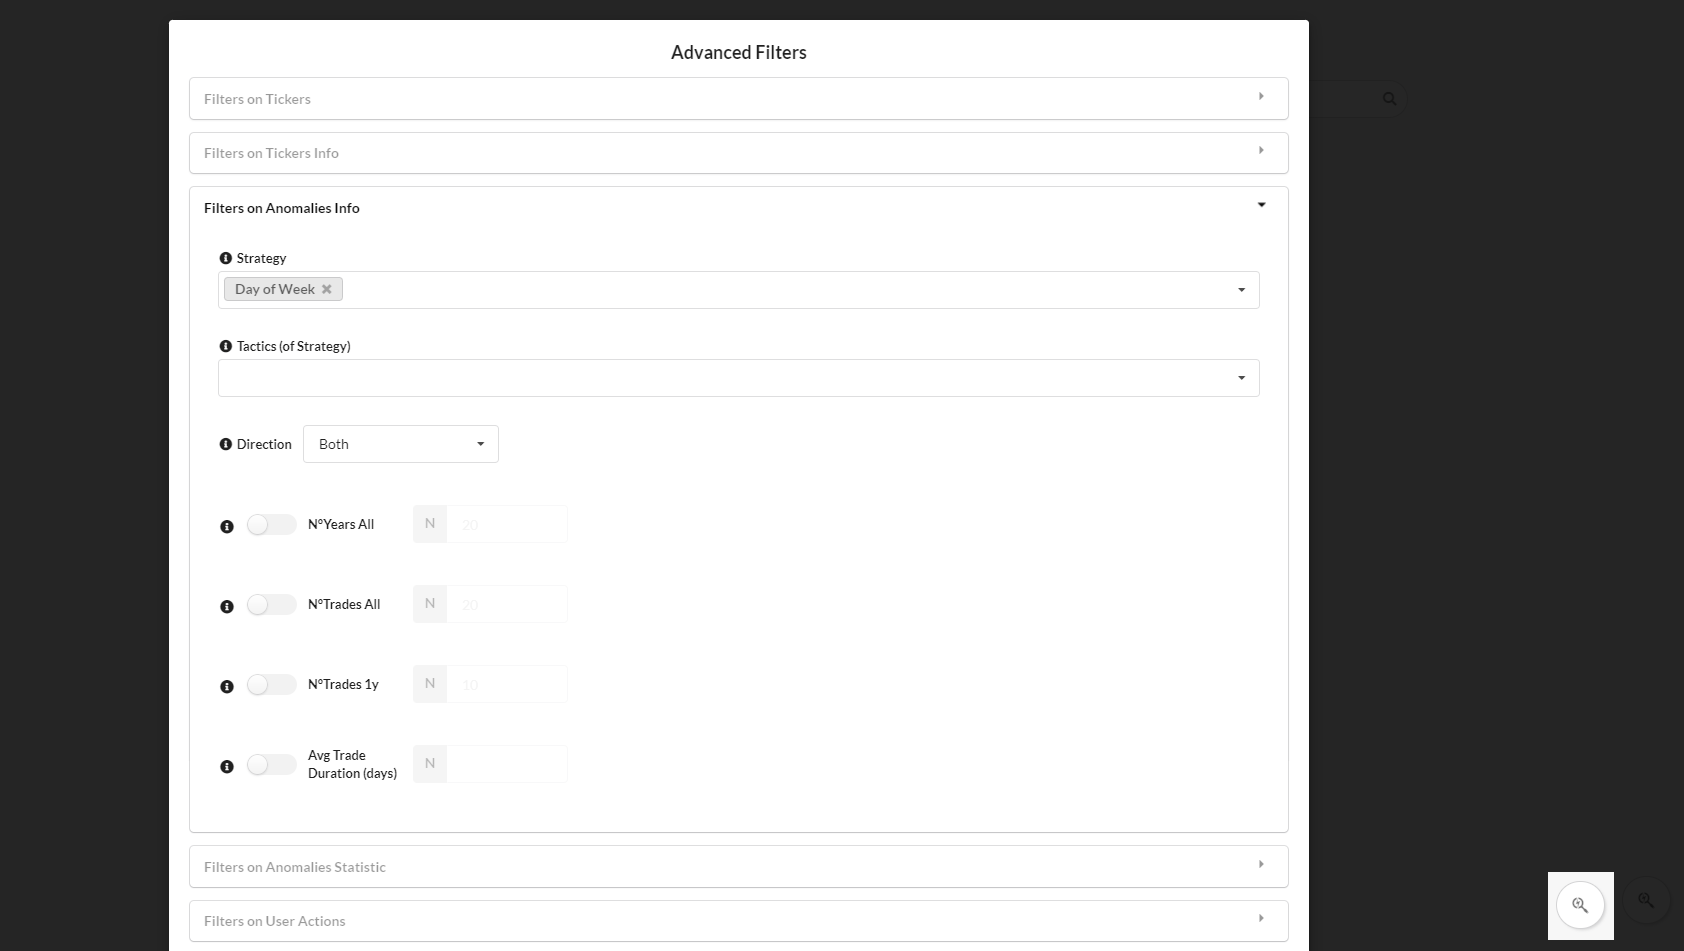
TDW Strategies Screener
It is possible to use the Screener to evaluate the backtests of the strongest TDW Strategies among all the Tickers in the Anomalies Ranking page:
- a video tutorial is available in this Youtube Video
- the description of the page is available in this article.
ForecastCycles
Get the latest trends on the market