
Month of the year effect (MOY)
Month of the year effect (MOY) is analyzed with two strategies:
- both enter in the market at the beginning of a month (1: January, 12: December), and
- close the position
- MOY at the end of the same month
- MOY_multi at the end of a following month.
For example:
- MOY 1:
- opens the position at the OP of the first TD of January and
- closes it at the CP of the last TD of January.
- MOY_multi 1_3:
- opens the position at the OP of the first TD of January, and
- closes it at the CP of last TD of March.
Legend:
- OP: Opening Price
- CP: Closing Price
- TD: Trading Day
Literature review
In literature, the research show anomalies in multiple Months of the Year for several markets.
Keloharju et al. , to evaluate MOY effect, did a regression on monthly return data from January 1963 to December 2016 of stocks listed on the NYSE, Amex and Nasdaq. By looking that the same-month coefficients they state that the same-month stock return is significantly predictive of future stock returns up to 20 years into the future.
The January effect
The January effect is a calendar anomaly reported in the financial markets wherein the returns in the month of January are higher than the returns during any other month of the year.
Keim observed that in January tended to concentrate practically the entire excess return generated in the medium term by small caps compared to large stocks. And that the entire stock market, on average in January, has generated performances above the other months of the year.
Numerous studies done in the following years have validated the persistence of the January Effect over time, not only with reference to the US stock market, but also on other world stock markets . Although the presence of the January Effect is unanimously proven, there is no accepted interpretation on its causes.
Siegel in 2010 highlighted how the January Effect has significantly attenuated during the 90s, although it has not disappeared, only to reappear over the last decade.
September effect linked to the school calendar
September is one of the most evidenced months in literature, because it is the unique month in which mostly of the stock market indices have a negative average performance, on average 1.62% lower than other months returns.
L.Fang et.al. in their paper “School Holidays and Stock Market Seasonality“, linked the September effect to the post-school holidays, having found a strong link with negative equities performance. They have found that for some regions, in which schools start the new year in August, the September effect is shifted to August.
To demonstrate that:
- they firstly found a local bias among investors: institutional investors use to own more local firms than far ones, because they have, or believe to have, an information advantage on them.
- Then divided US Stocks in 2 groups according to their headquarter:
- Northern states, where school starts in Septembe have negative September returns.
- Southern states, where school starts in August have negative August returns.
Some extracts from their paper:
“The September effect is true for all “Western” and developed economies in the Northern Hemisphere and the differences are almost always significant. Averaged across all countries, September returns are 1.62% lower than other months’ returns. We note that August is also usually a low return month. As a comparison, January returns are, on average, 1.45% higher than other months.
Of the 47 countries analyzed:
- 37 are in the North Hemisphere and September column is dominated by negative average returns, with 28 negative returns. Looking at the global average, September is also the lowest return month with a negative return of − 0.03%, while all other months have positive averages.
- 10 are in the US southern states, where in Georgia, Indiana, Nevada, Oklahoma, Tennessee, and Hawaii, school holiday ends in early August. For stocks headquartered in these states, we find that it is August, rather than September, that exhibits particularly low returns. Returns during the months after major school holidays are 1.1% lower than other months with a t-stat of 9.61.
This effect can be explained by investor inattention during school holidays because traders are more away from the market, either on vacation or in summer homes so they pay less attention to the market and are less likely to trade.
We noticed an investor local bias leaded by the fact that local institutional investors have an information advantage and, as such, their trading plays an important role in incorporating the information of local firms.
In addition:
- we evidenced that low post-school holiday returns are driven by stocks that release negative news, and especially those that also experience light trading, during school holidays, due to investor inattention during school holidays resulting in news, and especially negative news, being incorporated more slowly into prices. Prior research indicates that prices generally respond more slowly to negative news than positive news.
- we discovered that the post-school holiday effect is stronger among larger stocks and stocks with greater institutional holdings.
- we found that high-yield bond returns are 1.83% lower after school holidays than at other times.”
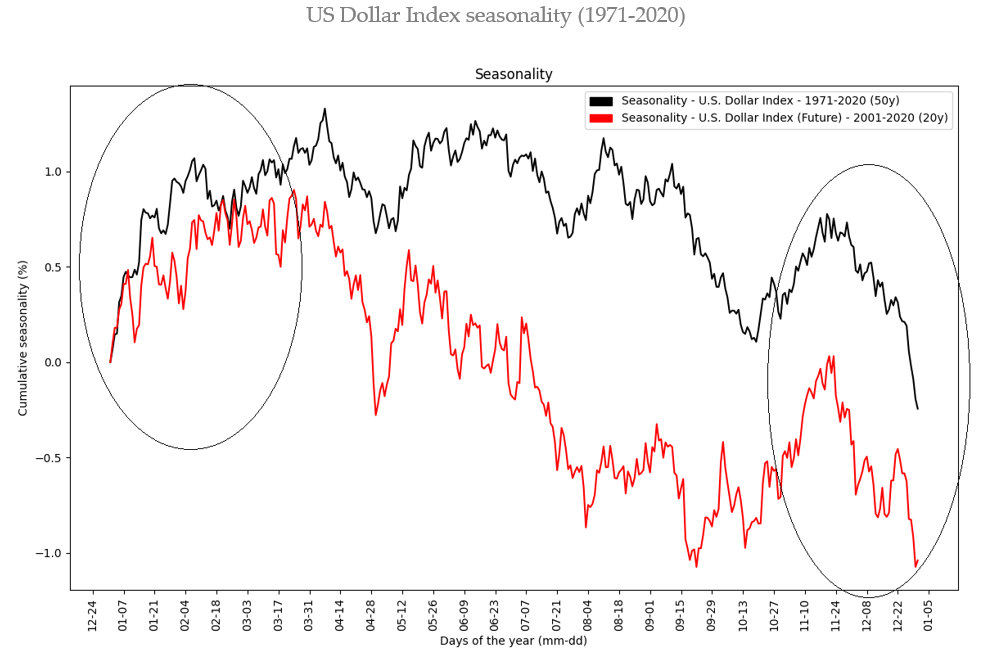
The US Dollar pattern
US Dollar tends to show:
- weakness at the end of the year and
- strength at the beginning of the new year.
The fact that the trend in the US dollar reverses precisely at the turn of the year already provides a strong hint regarding the reason for this seasonal pattern: it must be related to the end of the calendar year.
The question is: what happens at that point in time? It is the balance sheet date.
- The weakness of US dollar at the end of the year is driven by US tax legislation.
- Many US-based companies save on their tax liabilities by reporting small amounts of cash at the balance sheet date at the end of the year. It can be worthwhile to shift money to the accounts of overseas subsidiaries.
- The additional demand for foreign currencies affects the exchange rate, therefore the US dollar typically declines at the end of the year.
- The strenght of US dollar arrives after the turn of the year; at the beginning of the new year, the tide immediately turns because companies transfer sizable amounts back to the US.
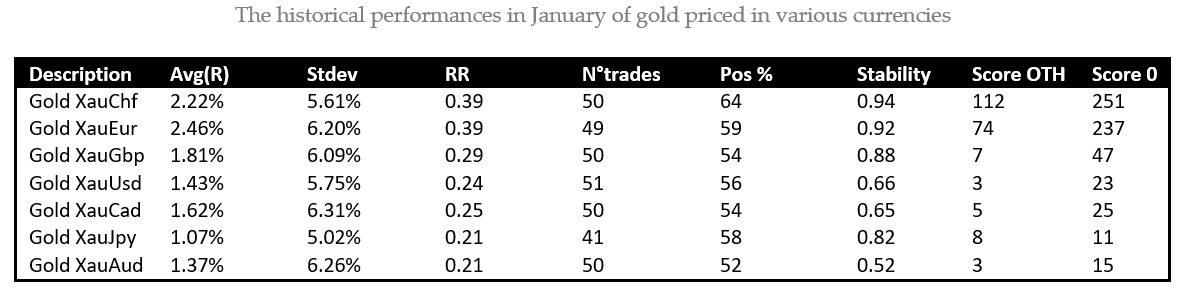
In the tables below, there are the most relevant MOY statistics I found in forex crosses, computed respectively in December and in January. I evidenced in the table the rows involving USD:
- in red the bearish indications for USD, and
- in green the bullish USD ones.
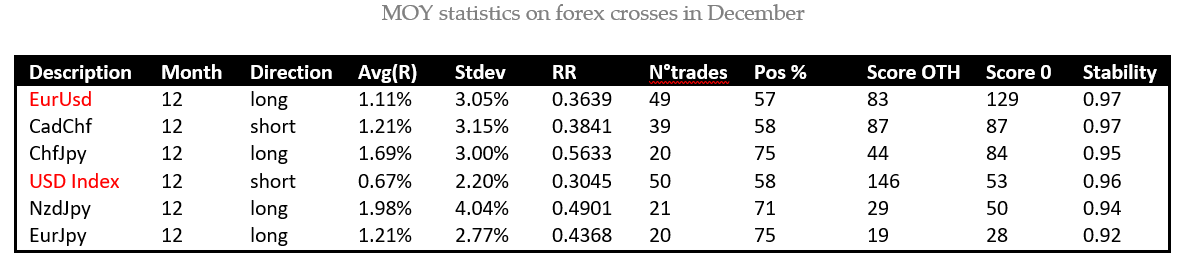
There are two strong evidence of a weak dollar in December (EurUsd and USD Index) with a p-value lower than 0.05 (so a ForecastCycles score greater than 20, given by 1/pValue).
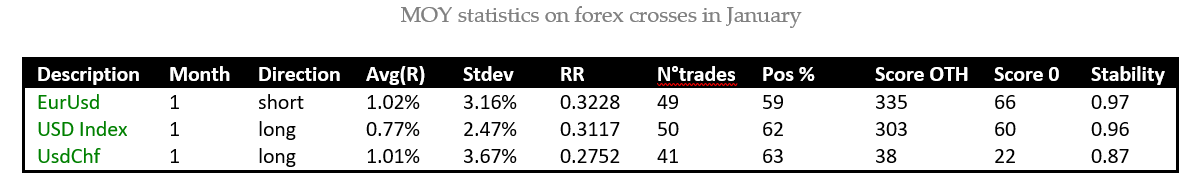
In the January month table, there are three evidence of a strong USD.
Below the two charts show the backtest of a MOY trading strategy in EurUsd: December short (left) and January long (right) from 1971 to 2020.
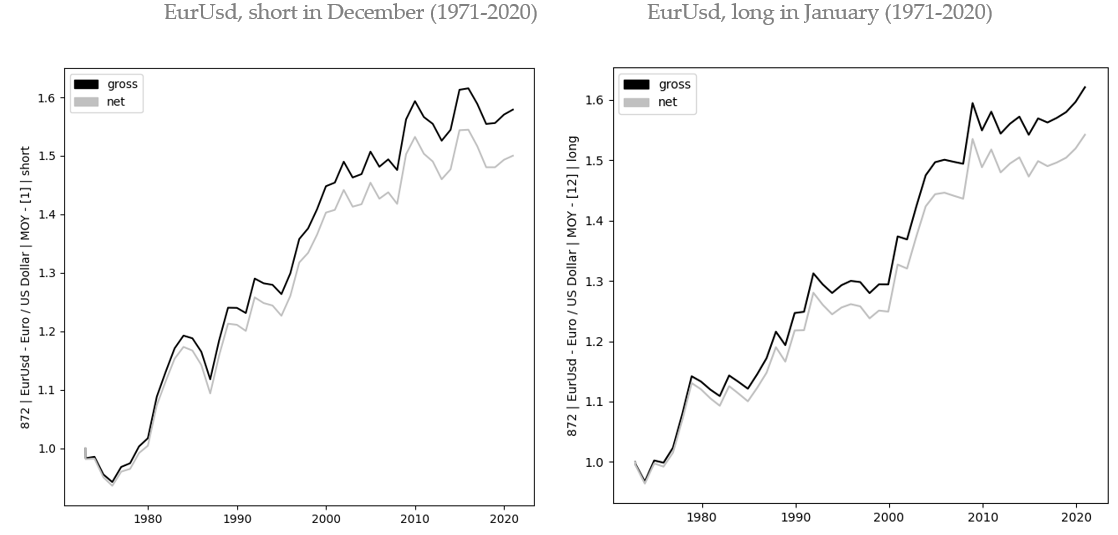
Both equity lines:
- are steadily increasing since 70’s with a slowdown in the more recent years in the December’s equity.
- have had a great historical stability, meaning that this phenomenon has been continuous during the last 50 years.
Precious metals demand in January
BullionVault is one of the world largest online investment service for physical precious metals. It reported that in 2010-2020 decade it has seen in January, 7 times out of 10 more new bullion investors than the monthly average, and that January was the very best month of the year 5 times.
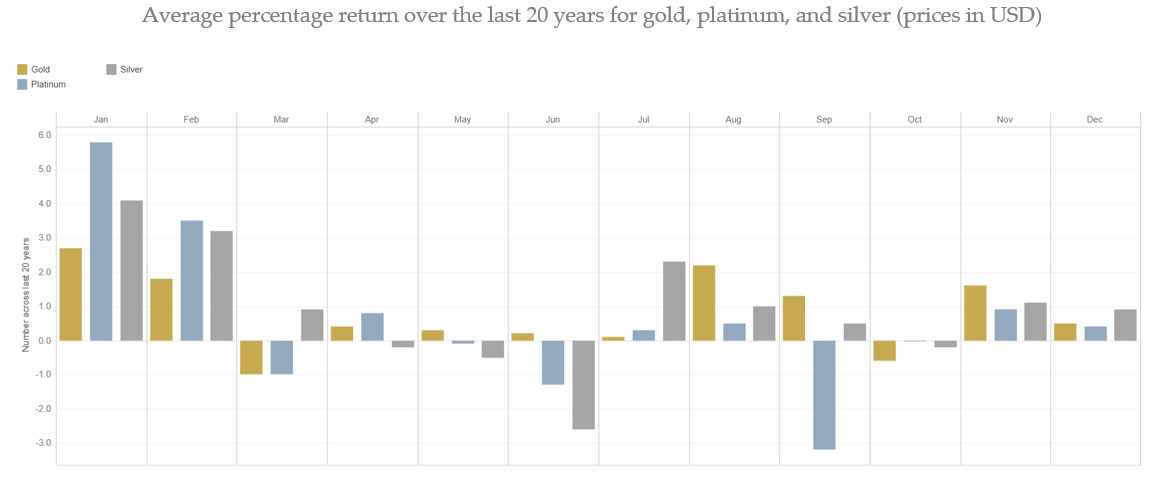
Precious metals prices used to rise in the days after New Year. In the last 20 January months:
- Gold, and Silver have both risen 14 times, 70% of the times
- Platinum 17 times, 85% of the times
Gold consumers demand is important for the price dynamic and it use to peak during major countries holidays. China has become the 1st world's gold consumer nation and demand in China peaks during the Chinese New Year, that occurs every year in a different date but always between January and February.
In Chart below there are the seasonalities of precious metals computed from 1987 to 2020. I evidenced with a black circle the January’s average upward movement of all the four metals.
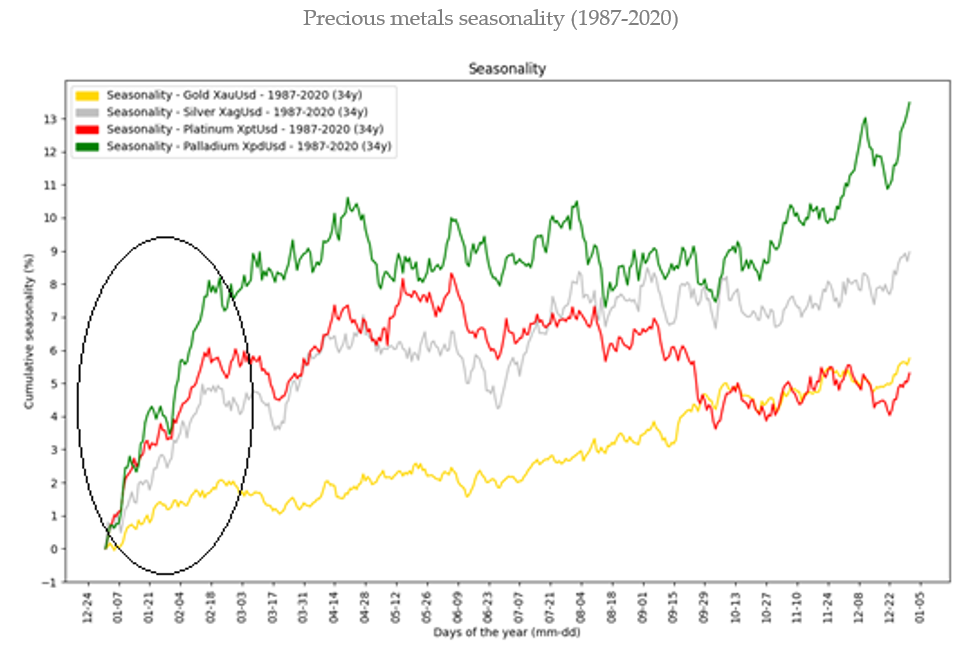
In the last 34 years all precious metals have been strong, on average:
- from the days before Christmas
- to the days around mid-February, in correspondence to the Chinese New Year and St. Valentine Day. After that periods metal prices tended to significantly slow down.
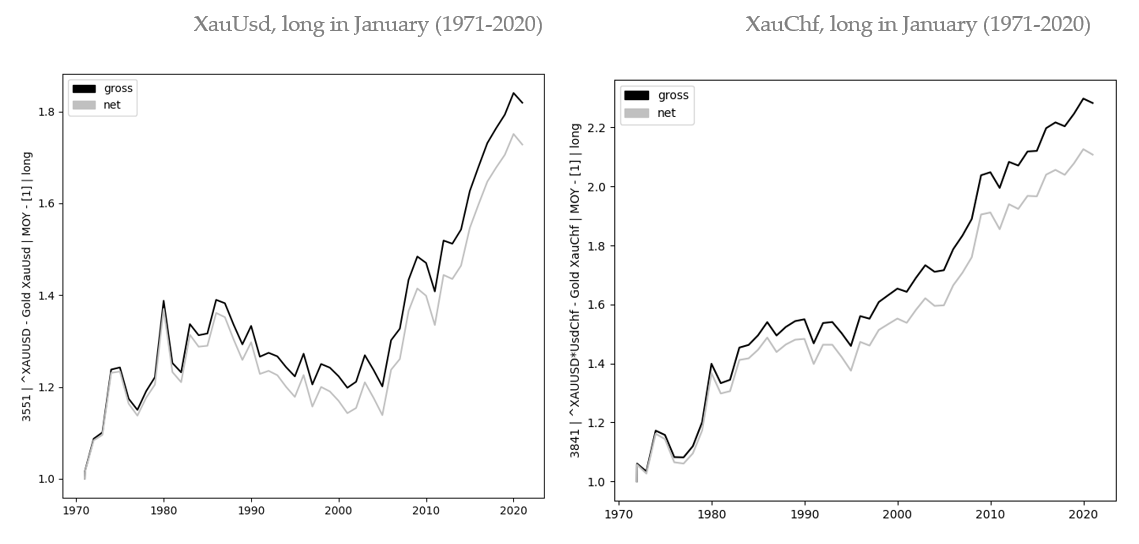
January, as seen above, has been one of the most bullish months for both:
- Gold, and the other precious metals, and
- US dollar
Gold and silver are negatively correlated to the Dollar Index, and so in the Chart below is possible to notice that trading Gold in a currency different from USD, such as CHF, is giving better and more stable results.
There are explanations given by some authors regarding the positive January returns for precious metals, but these explanations have not been confirmed with data:
- In January investors use to review their portfolio and they rebalance their holdings of bullion, equities, and bonds; in particular, wealth managers and private savers give more focus on potential risks to their money, so they choose to buy a little investment insurance for protection.
- About both silver and platinum, they find most of their demand today from industrial use. Some automakers, chemical plants, pharmaceutical companies, and other manufacturers book their supplies for the coming year in January.

Month of the year effect - MT4 Expert Advisor
These strategies enters in the market at the beginning of a month (1: January, 12: December) and close the position at the end of the same month or at the end of a following month
To trade automatically this anomaly, you can purchase the "MOY Expert Advisor". The Expert Advisor needs the "Main EA and libraries" to work. If you have an active ForecastCycles membership, contact us to get 20% discount.