Algorithmic Rank page
Algorithmic Rank page can give hints about statistical opportunities based on Seasonality to exploit in the current month.
Introduction
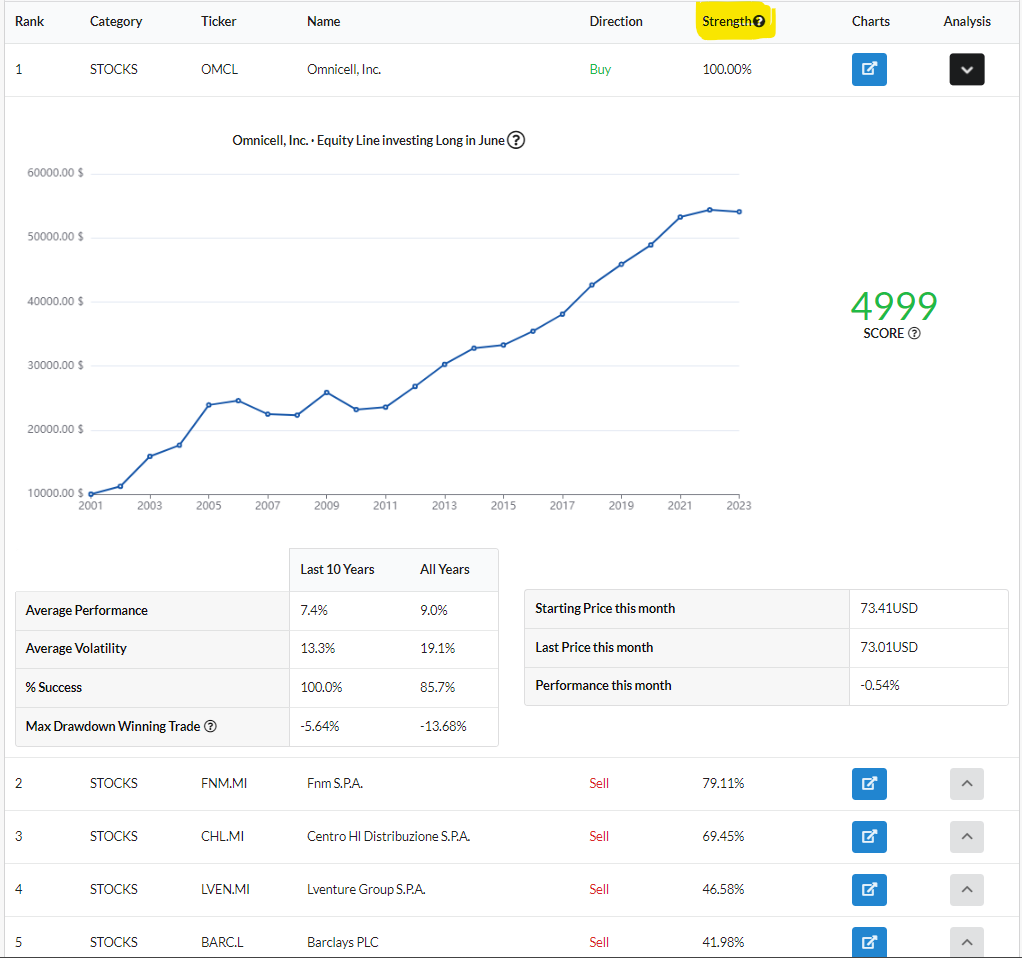
It contains the ranking of financial symbols that have the best statistics, according to a proprietary algorithm, from the current day to the end of the current month.
It can be especially useful in the first part of the month, when there are still many trading days for Tickers to express performance. While it progressively loses importance towards the last days of the month.
The Ranking
The Ranking is based on the Score, and then Strength, of each Ticker.
The Scores are used to compute the Strenght in the Ranking table:
- the first Ticker in the rank has the maximum Strenght (100%) since it has the maximum Score (4999);
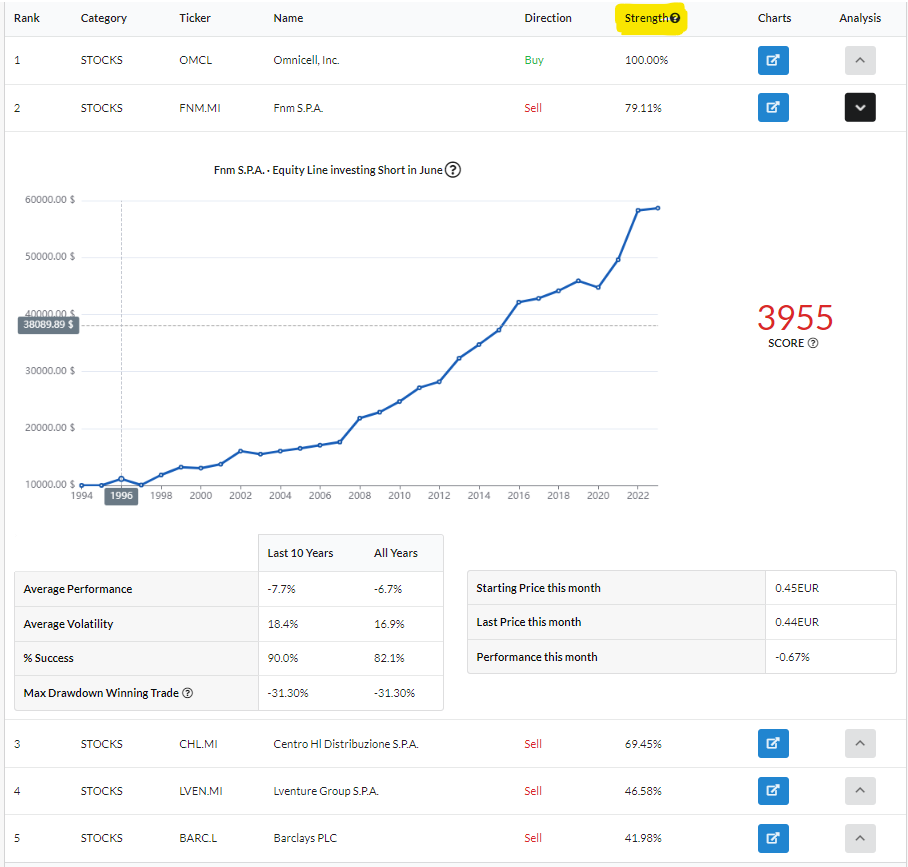
- the second Ticker has a Score of 3955, and a Streght of 79.11%, given by 3955 / 4999.


How Scores are computed
The algorithm:
- takes in consideration different statistics of the backtest:
- Average Return
- Standard Deviation
- Winning Percentage
- Drawdown
- compute an average between the statistics measured in two periods
- the entire history
- the last 10 years
- gives a score considering statistics, and in addition is updated daily with this logic:
- each Ticker has an expected return in the current month given by the average return
- it compute the difference between the actual and the expected return obtained, and adjust the final score
How to see the Ranking for all the Months
Algorithmic Rank page was one of the first developed. During the years ForecastCycles Platform has evolved.
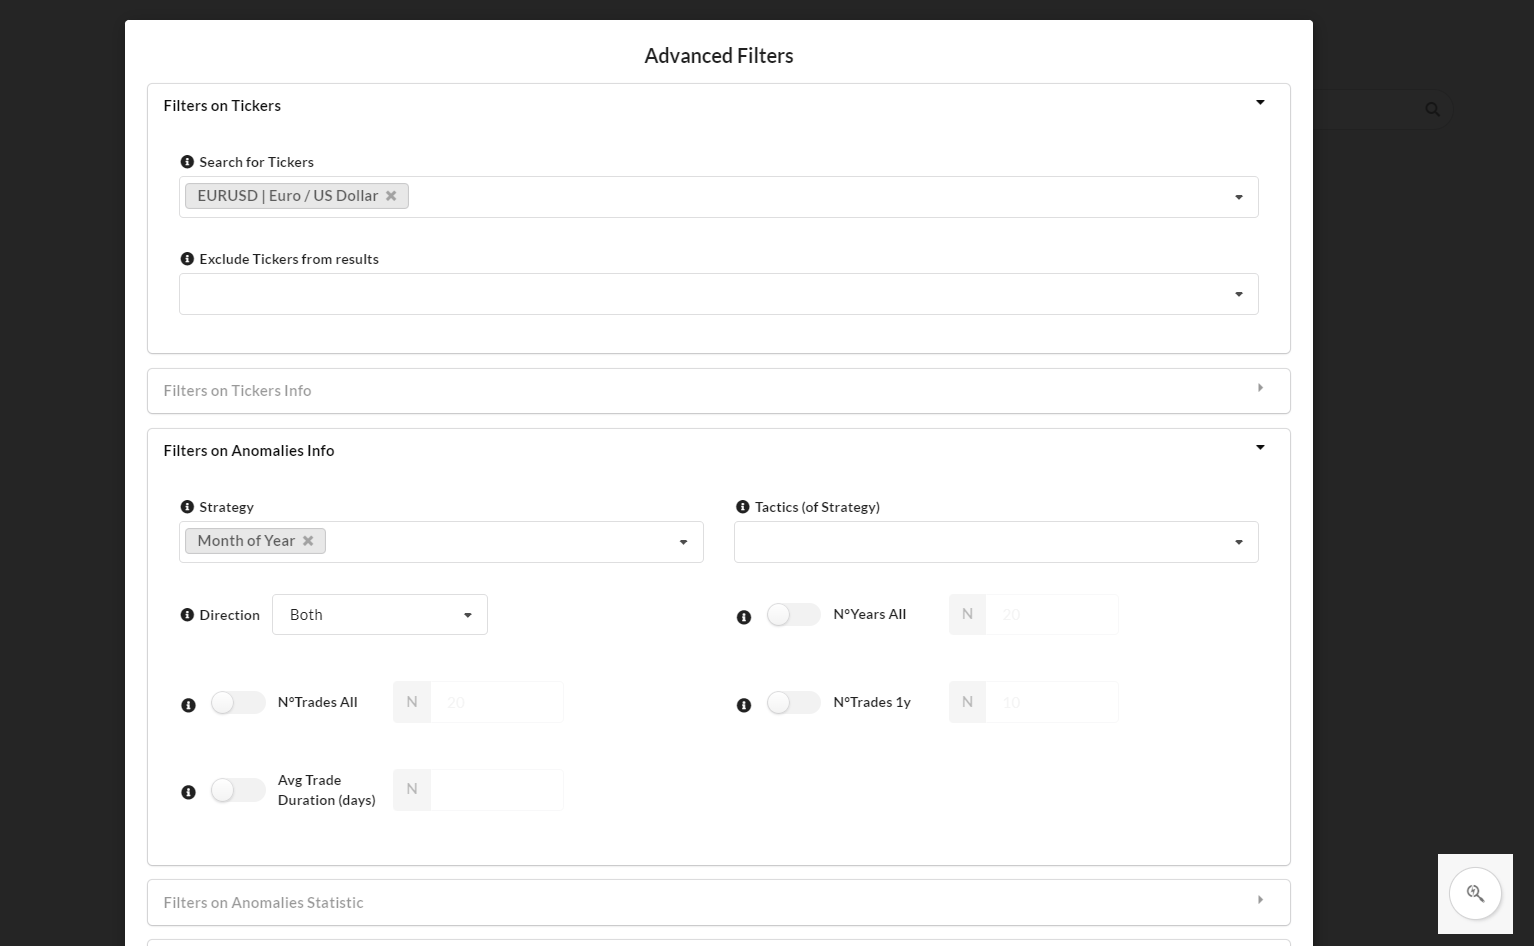
It is possible to see the Ranking for all the Months and Tickers in the Anomalies Ranking page:
- a video tutorial is available in this Youtube Video
- the description of the page is available in this article.

Videos on YouTube
Algorithmic Rank presentation and tutorial are available on YouTube


