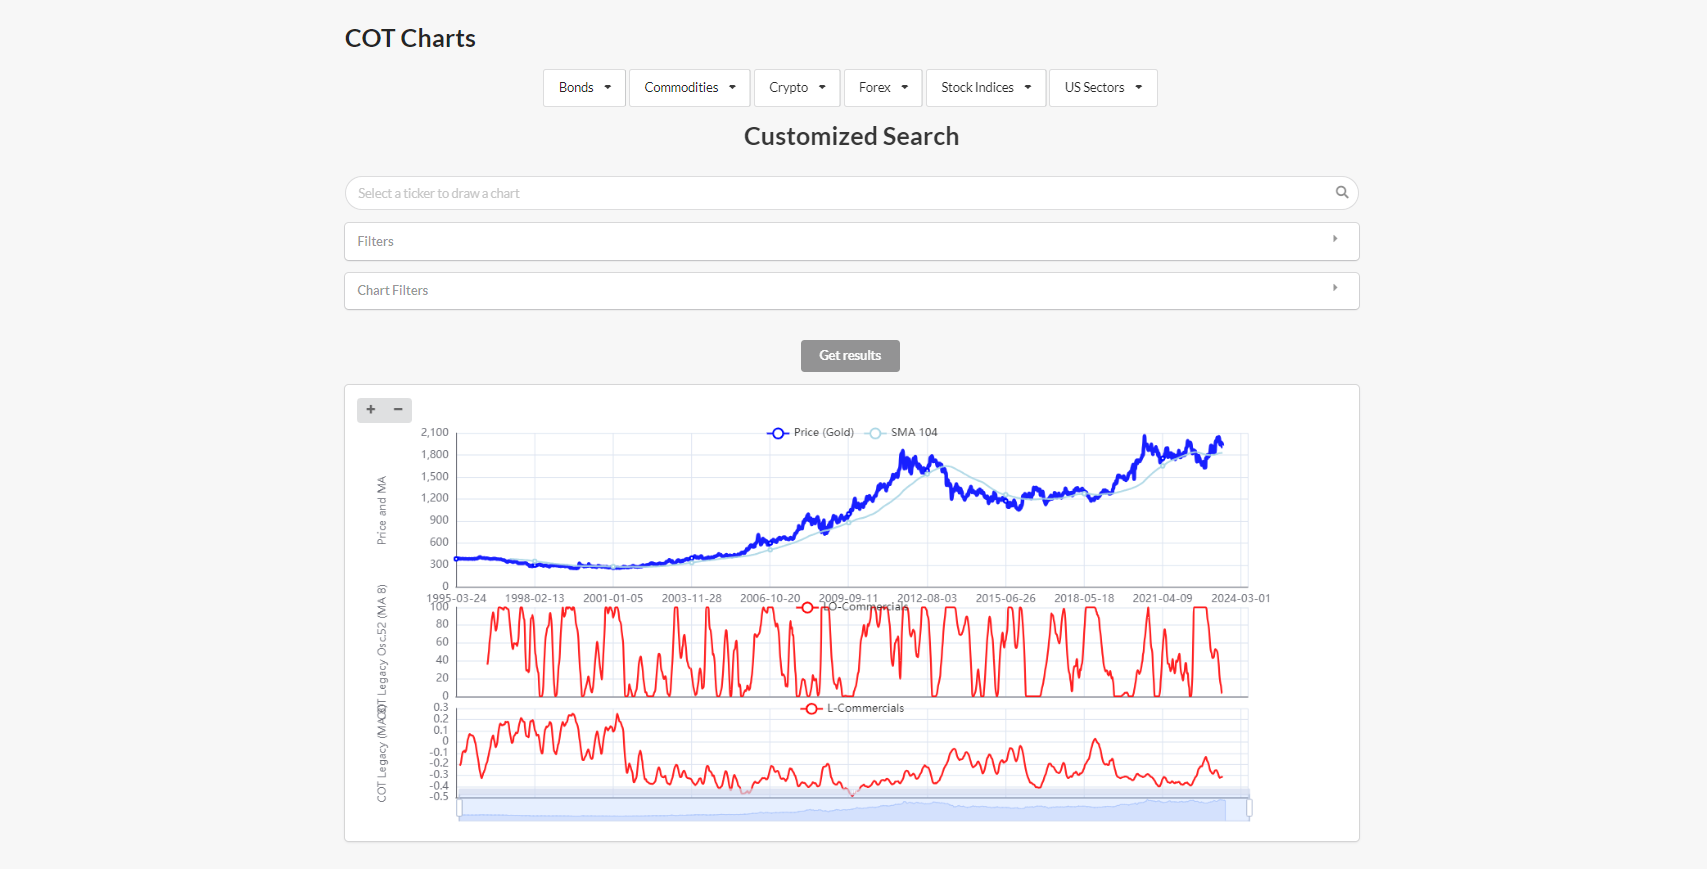
COT Charts page
COT data is available for around 50 Tickers, listed in this article.
In ForecastCycles there are 2 ways to display COT data.
1. Selecting a Ticker from the COT Menu
The COT drop-down menu includes all-instrument having COT data available, divided by their Asset-Class.
By clicking one instrument, it will be displayed the COT Charts with the groups of traders that provide the most reliable information to analyze the selected Ticker, as explained in this article.

2. Using Ticker Search and COT Filters
The Customize Search permits to change the default COT data elaboration and charts visualization, through:
-
Ticker search
Search and select the Ticker. -
Filters
Select the parameters to be used to elaborate raw COT data. -
Chart Filters
Choose to display:- which groups of Traders of Legacy and Disaggregated Reports
- the COT Oscillators
- the Detrended Seasonality


