Macro & Stats page
Macro & Stats page contains a collection of Indicators that help identifying the state of the economy and the under/overvaluation of markets.
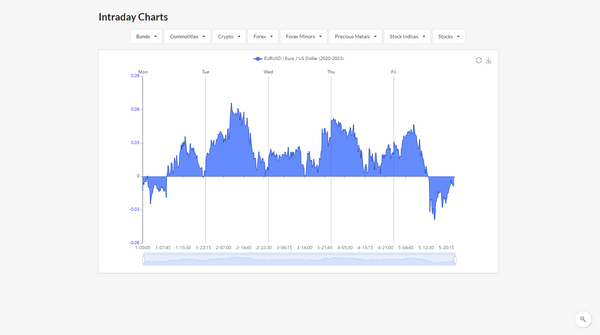
Plot Macro & Stats Chart
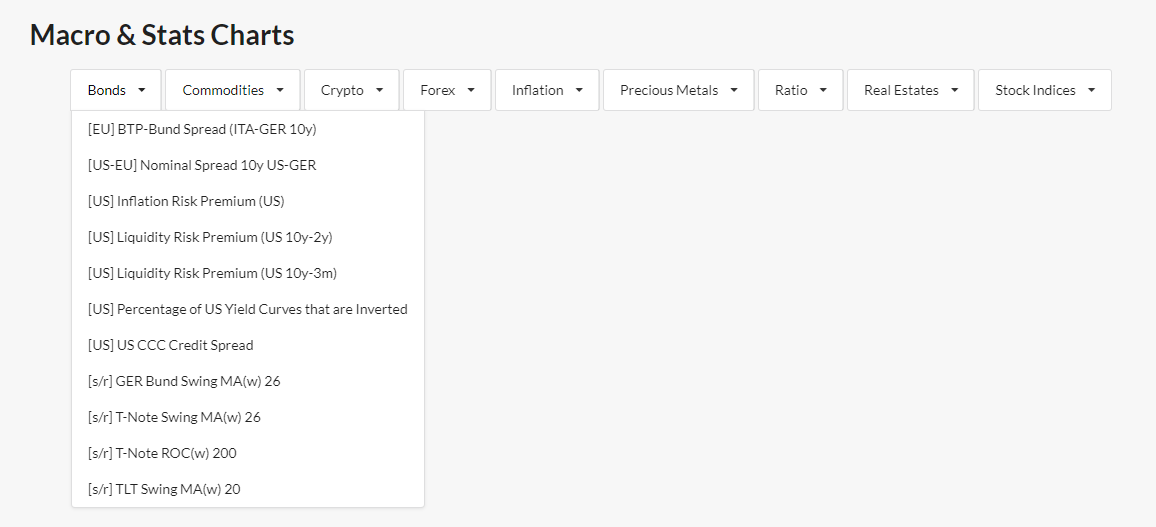
In the top of the page there is the drop-down Menu, with Indicators dividend into Asset Classes. It may be that an Indicator gives useful information on more than one Asset class.
To plot a Chart you have to select an indicator from the Menu.

Indicator Names
Usually there is a prefix in the name of the Inidcators:
- with Country or Region, for example [US] United States, [EU] Europe.
- [s/r] meaning that is a Swing on Moving Average or a Rate Of Change indicator.
Charts and Indicator Description
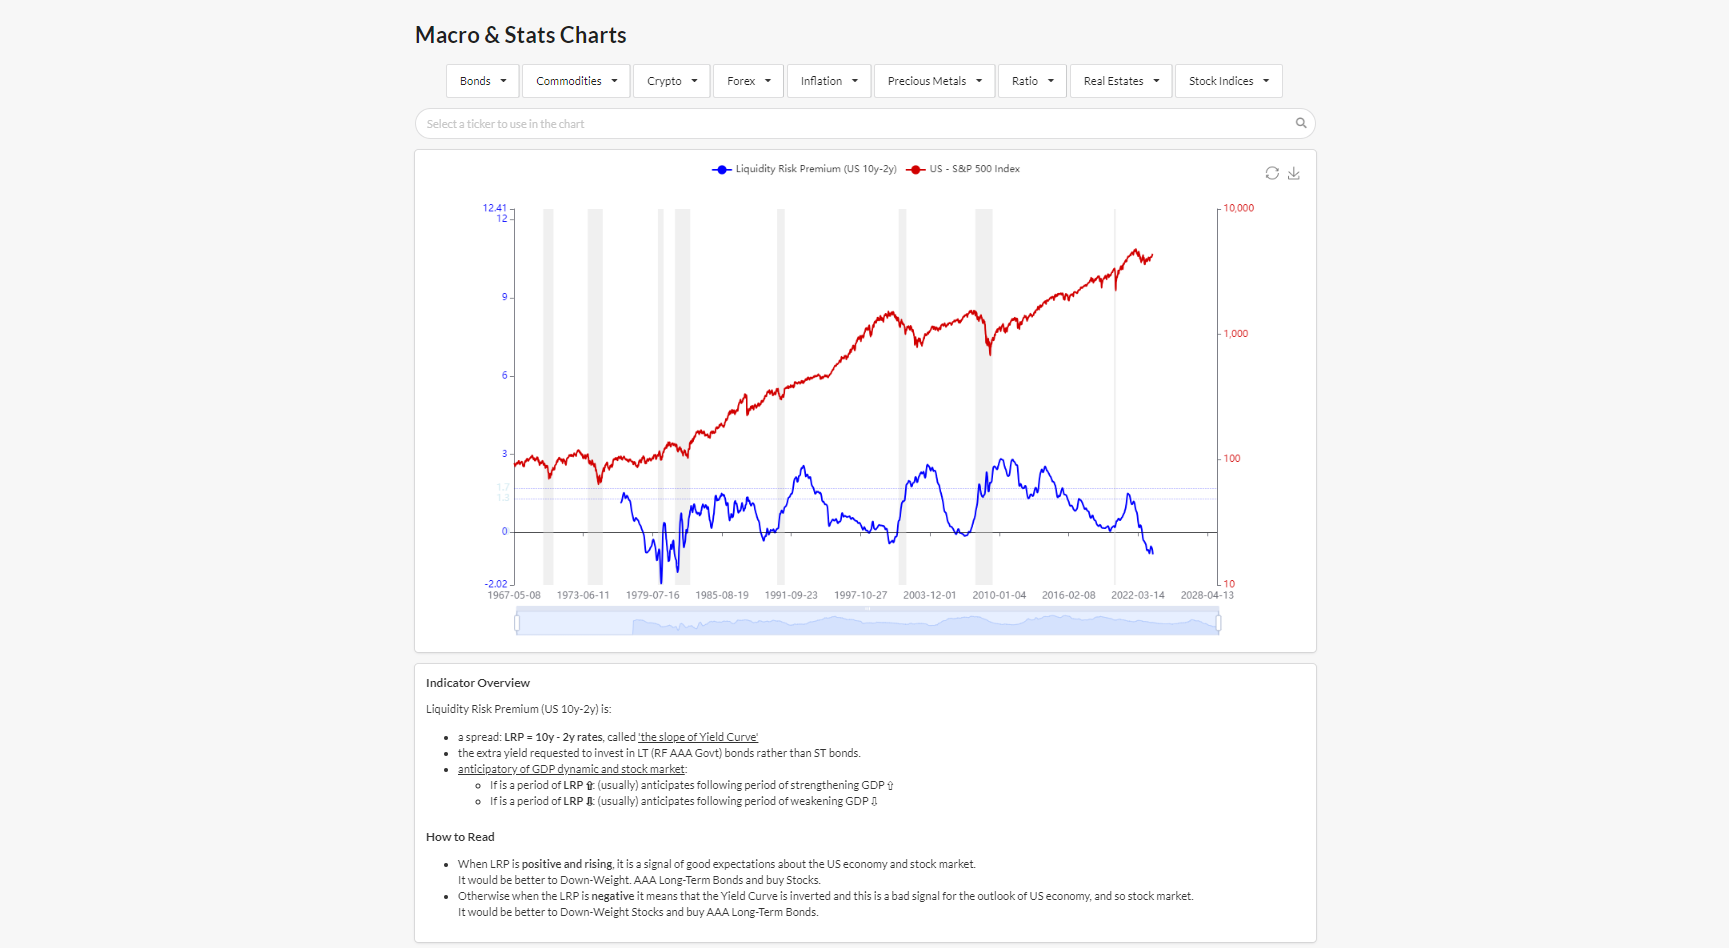
For the majority of Indicators:
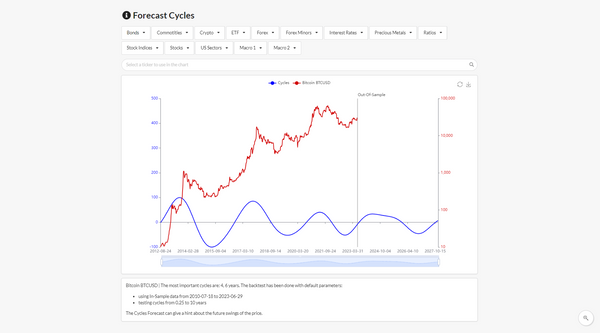
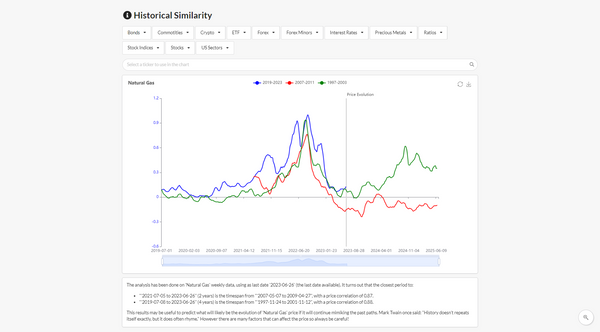
- There are 2 lines:
- Red is the Ticker
- Blue is the Indicator
- After the chart has been displayed, it appears the Ticker search-bar where you can search and select a Ticker, which will be shown in the chart instead of the default one shown.
For all the Indicators:
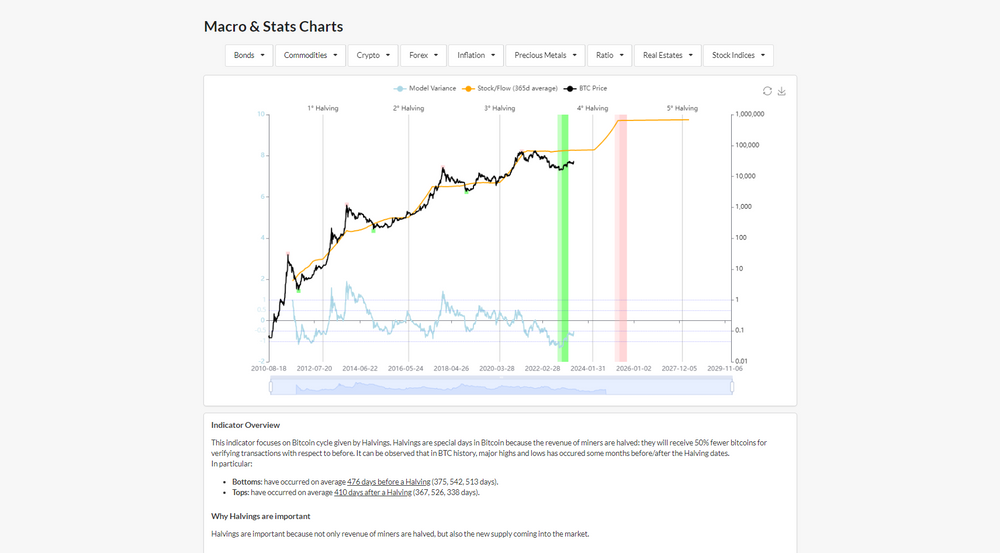
- In the chart, grey areas represents US Recessions.
- In the bottom of the page there is the Indicator description.
It is possible to explore the platform for Free, and decide later whether to become a Premium member, to unlock full data of Macro & Stats Charts, and more.
ForecastCycles
Get the latest trends on the market