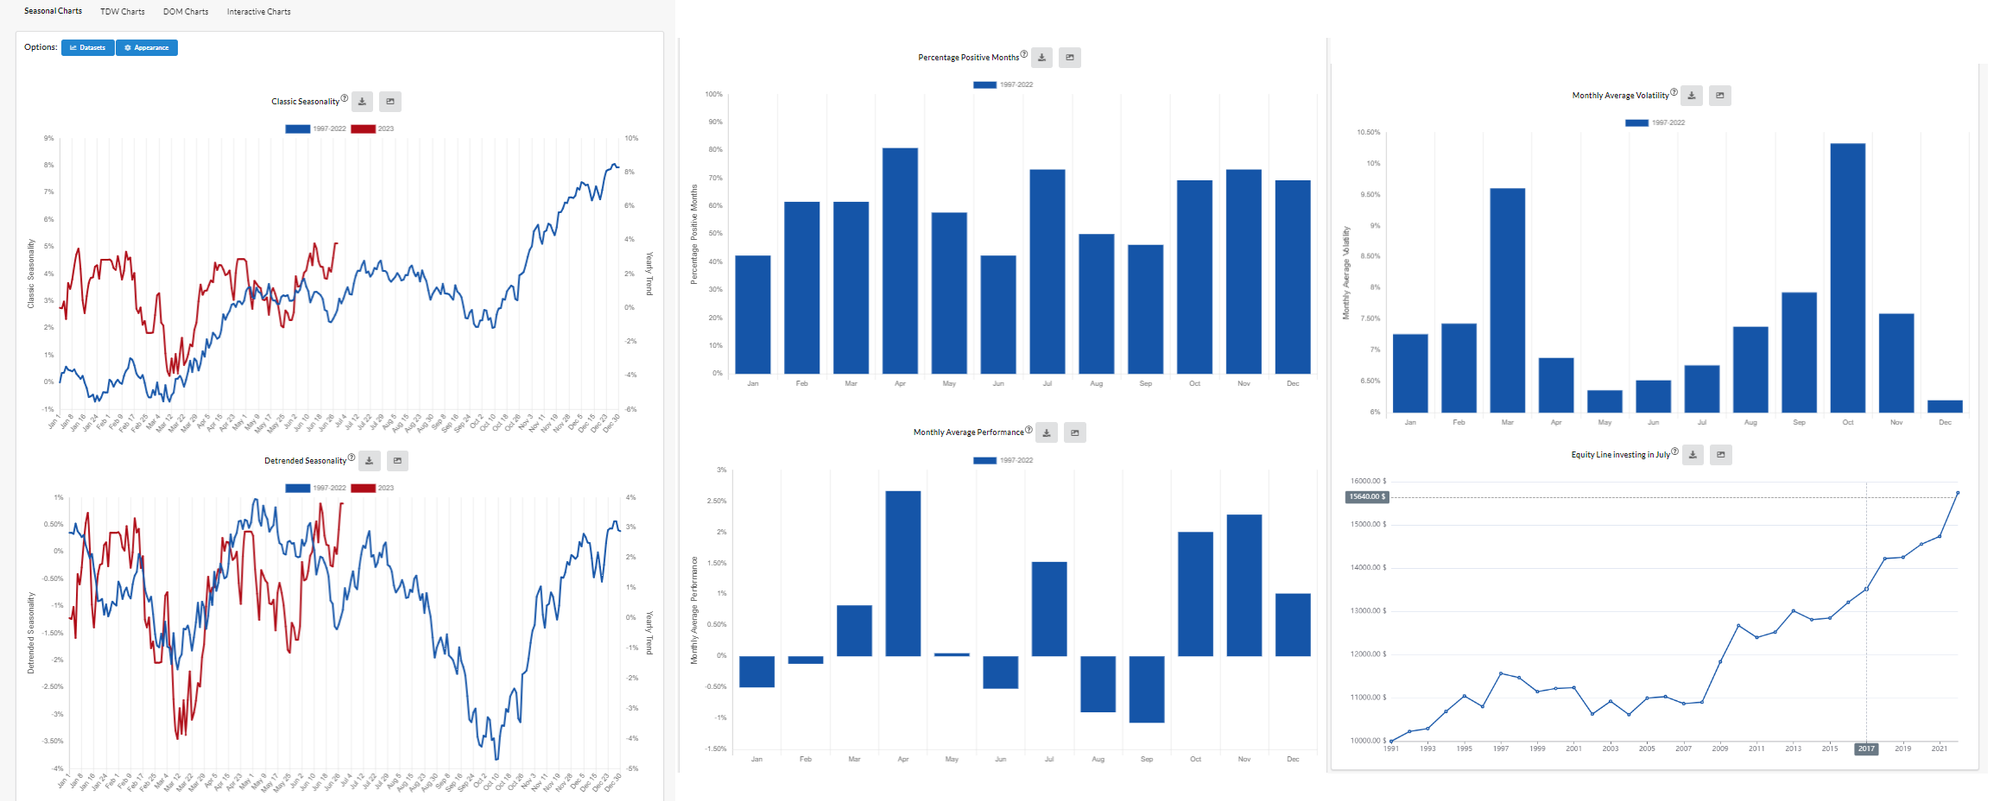
Seasonality Charts
Seasonality is one of the component of financial instrument price evolution, and it one of the main object of analysis in ForecastCycles Platform.
Introduction
We can measure Seasonality by taking the average return of a financial instrument in periods within the calendar year, for example to see whether there are months having returns significantly different from other months.
An overview about the cycles and Seasonality in nature, human life, and financial markets is available in this article.
Seasonality pages
The Seasonality pages in ForecastCycles Platform are 3:
- Seasonal Charts
many Charts to analyze Seasonality in different Months, Weekdays, and Days of Month. - Algorithmic Rank
the Ranking of Tickers having the best seasonal statistics, from the current day to the end of the current month. - Best Seasonality
the Ranking of Tickers sorted by the Correlation to their Best Seasonality
Videos on YouTube
Seasonal Charts and Algorithmic Rank presentations and tutorials are available on YouTube
The Evolution of Seasonality
Seasonal Anomalies
Seasonality section has been the first developed, and the starting point of ForecastCycles Platform.
In the following years, it has been developed the Seasonal Anomalies section that contains thousands of Anomalies, which are:
- Trading Strategies known also as BIAS
- Statistical evidences derived from Seasonality analyzed in many more periods within the calendar year, for example:
- in the days around Holidays
- in the days around the Turn of the Month, etc.
The Seasonal Anomalies World is presented in this article.
Intraday Charts
In addition, it is now available also the Intraday Charts page, with seasonality computed within each Weekday in a 15 minute timeframe. You find a explanations about this page in this article.

It is possible to explore the platform for Free, and decide later whether to become a Premium member, to unlock all the features of the 7 Sections.


